To prevent spam users, you can only post on this forum after registration, which is by invitation. If you want to post on the forum, please send me a mail (h DOT m DOT w DOT verbeek AT tue DOT nl) and I'll send you an invitation in return for an account.
Metric Data in ProM
Hello all,
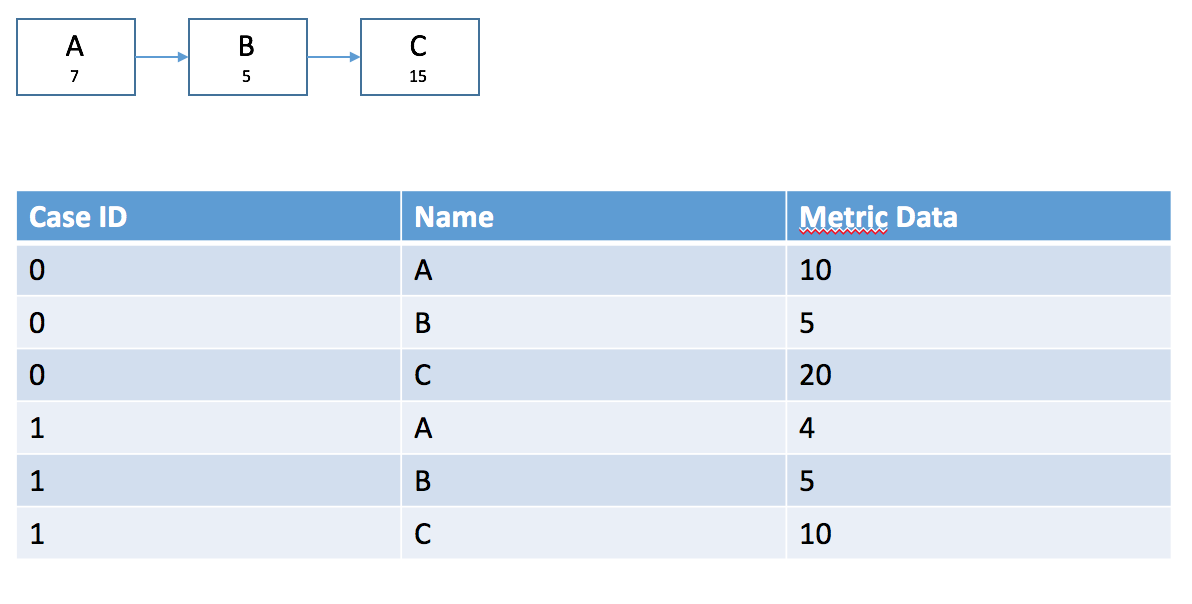
related to my research I have to analyze metric data like costs. I was asking my self if there is any possibility to show the average of the data inside some Petri-Net or something like that?
My Event-Log looks like that:
Case ID Activity Metric Data (for example costs)
0 A 10
0 B 5
0 c 20
1 A 4
...
In the corresponding model the activity should be now weighted with 7. I hope you know what I mean.
Best regards
Daniel
Comments
-
An here some illustration..

-
Hi Daniel,
I'm not aware of a generic solution.
I do know that Moe Wynn from QUT, and her colleagues, are working on cost (and risk) in process mining so their work might be of help here.
Joos Buijs
Senior Data Scientist and process mining expert at APG (Dutch pension fund executor).
Previously Assistant Professor in Process Mining at Eindhoven University of Technology
Howdy, Stranger!
Categories
- 1.6K All Categories
- 45 Announcements / News
- 225 Process Mining
- 6 - BPI Challenge 2020
- 9 - BPI Challenge 2019
- 24 - BPI Challenge 2018
- 27 - BPI Challenge 2017
- 8 - BPI Challenge 2016
- 68 Research
- 1K ProM 6
- 395 - Usage
- 289 - Development
- 9 RapidProM
- 1 - Usage
- 7 - Development
- 54 ProM5
- 19 - Usage
- 187 Event Logs
- 32 - ProMimport
- 75 - XESame
