To prevent spam users, you can only post on this forum after registration, which is by invitation. If you want to post on the forum, please send me a mail (h DOT m DOT w DOT verbeek AT tue DOT nl) and I'll send you an invitation in return for an account.
Flexible Heuristics Miner - Inconsistent frequencies
Hello Guys,
I am currently analyzing process logs in course of my master's thesis, where I use the plug-in "Mine for a Heuristic Net using Heuristics Miner" in ProM SilvR.
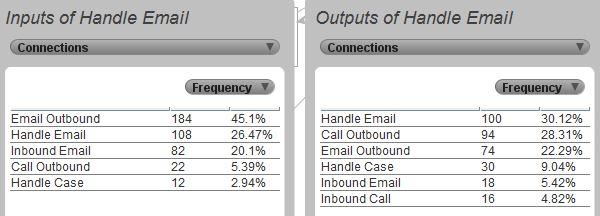
After using the plug-in, I noticed that when I compare the Input and Output Summary for each activity with the actual arcs in the model, the numbers are often quite different. This holds true over different threshhold configurations.
In addition, the occurences of input- and output activities that from my understanding should be the same are also different, for example when an activity is connected to itself.
An example:
I used the plugin on the ExampleLog, giving this exemplary graph:

On the model (not depicted here) it can be seen that the activity is 102-times followed by itself (the arc indicating a length-one-loop is marked with the number 102), however, input shows 108 and the output shows 100.
Shouldnt they all be the same? And are those differences an issue of the plug-in itself, or do they emerge from the design of the algorithm?
Thank you very much for your inconvenience.
Best Regards,
Johannes
I am currently analyzing process logs in course of my master's thesis, where I use the plug-in "Mine for a Heuristic Net using Heuristics Miner" in ProM SilvR.
After using the plug-in, I noticed that when I compare the Input and Output Summary for each activity with the actual arcs in the model, the numbers are often quite different. This holds true over different threshhold configurations.
In addition, the occurences of input- and output activities that from my understanding should be the same are also different, for example when an activity is connected to itself.
An example:
I used the plugin on the ExampleLog, giving this exemplary graph:

On the model (not depicted here) it can be seen that the activity is 102-times followed by itself (the arc indicating a length-one-loop is marked with the number 102), however, input shows 108 and the output shows 100.
Shouldnt they all be the same? And are those differences an issue of the plug-in itself, or do they emerge from the design of the algorithm?
Thank you very much for your inconvenience.
Best Regards,
Johannes
Comments
-
I've noticed the same. Which parameters did you use to run the plugin?
-
Hello hypermau,
the problem persists over different parameter settings; I tried it with the pre-defined thresholds (everything 90.0 & Relative-To-Best Ratio 5.0), as well as when I want an "unfiltered" view by setting all thresholds to 0.
Greetings,
Johannes
-
Hey Jowo,
Thanks for the report! In the near future we're looking into reimplementing the HM and we'll look into this as well.
Regards,
Maikel.
Howdy, Stranger!
Categories
- 1.6K All Categories
- 45 Announcements / News
- 225 Process Mining
- 6 - BPI Challenge 2020
- 9 - BPI Challenge 2019
- 24 - BPI Challenge 2018
- 27 - BPI Challenge 2017
- 8 - BPI Challenge 2016
- 68 Research
- 1K ProM 6
- 395 - Usage
- 289 - Development
- 9 RapidProM
- 1 - Usage
- 7 - Development
- 54 ProM5
- 19 - Usage
- 187 Event Logs
- 32 - ProMimport
- 75 - XESame