
New user - Animations & logs problem

Hi
I'm trying to get started with ProM but cant progess very far - I am total beginner and have used bupaR but ProM is very different.
I want to do 2 things :
(1) Convert a CSV file to XES file
(2) Produce an animation of the process from the newly converted XES file.
So the csv file is very simple - we have 2 events for case-7777 AB & AC that occur , each with a start and end time :
case_number,handling,handling_id,start_time,end_time
case-7777,AB,approved2,2021-12-06 07:00:00,2021-12-06 08:00:00
case-7777,AC,approved3,2021-12-06 09:00:00,2021-12-06 10:00:00
Firstly , can I use this format ( above ) to produce an XES file that will work?
All I want to do is show each of these 2 events animated so you can see the token move left to right on the screen. Pretty simple.
I was concerned that I might need to change the CSV file format internally to get it to work, possibly with the start and end times on different lines? I am not sure.
We have a HUGE number of csv files in this format we want to put through ProM but until I can work out what I need to do with the formatting to get it to work , I cant use ProM.
Any help appreciated.
Thanks.
Comments
-
Hi,
You can import such a CSV file into ProM, and then use the Convert CSV to XES plugin to create an event log from it. For the configuration of this plugin, you could use the following:
- Case column: case_number (press the "+" button to the right to select this column.
- Event column: handling_id (dito)
- Start TIme: start_time (please check the date format below, but I guess it will be okay)
- End Time: end_time (dito)
Accept the defaults for all others, and finish the wizard. This will result in an event log containing 4 events: Two start events and 2 end (complete) events. On this event log, you could use the Mine with Inductive visual Miner plugin to discover a model and see an animation of the event log on that model.
Kind regards, Eric.
-
Thank you I got it working with your instructions.
How would I get the minutes or seconds between each node in a process please?
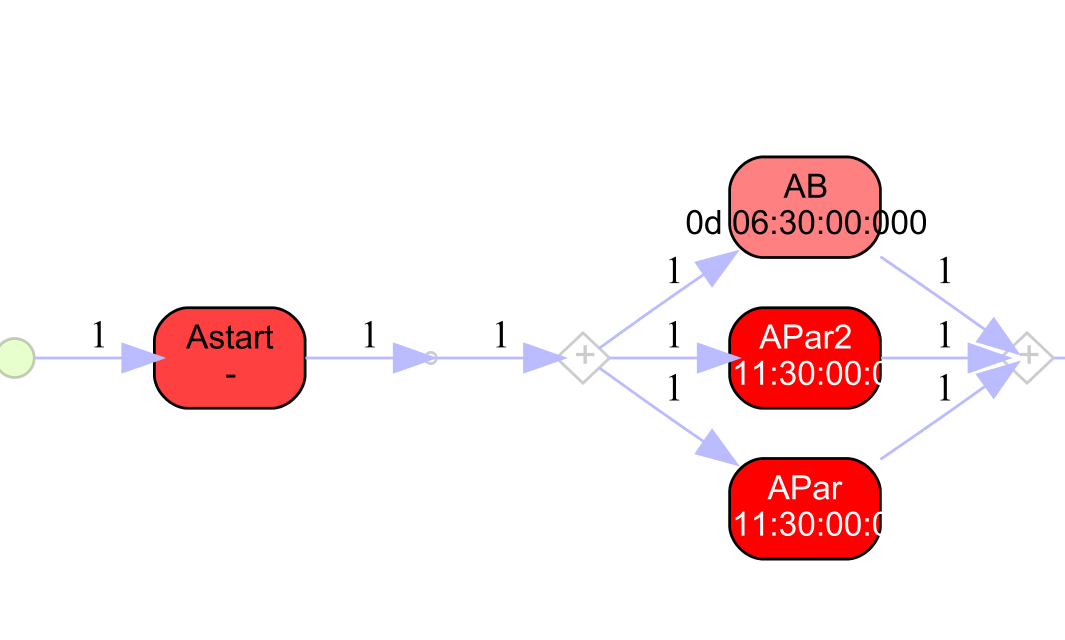
I can use life cycle miner shown below to give me the times taken for a particular activity to occur - for example in the node "AB" it takes 6h30 for the token to transition through that node/part of the process.
How do I display on the graph ( below ) the time it takes to for the token to travel from ( for example ) from Astart to AB or Astart to APar2 or Astart to APar please?
Thank you.
-
Hi,
For details on the Inductive visual Miner on how to use it, please see (Chapter 9 of) the PhD thesis of Sander Leemans. You can find the theses at https://research.tue.nl/files/63890938/20170509_Leemans.pdf.
Kind regards,
Eric.
-
Thanks

Howdy, Stranger!
Categories
- 1.6K All Categories
- 45 Announcements / News
- 225 Process Mining
- 6 - BPI Challenge 2020
- 9 - BPI Challenge 2019
- 24 - BPI Challenge 2018
- 27 - BPI Challenge 2017
- 8 - BPI Challenge 2016
- 68 Research
- 1K ProM 6
- 395 - Usage
- 291 - Development
- 9 RapidProM
- 1 - Usage
- 7 - Development
- 54 ProM5
- 19 - Usage
- 188 Event Logs
- 32 - ProMimport
- 75 - XESame