To prevent spam users, you can only post on this forum after registration, which is by invitation. If you want to post on the forum, please send me a mail (h DOT m DOT w DOT verbeek AT tue DOT nl) and I'll send you an invitation in return for an account.
Fuzzy Miner metrics
Hi there,
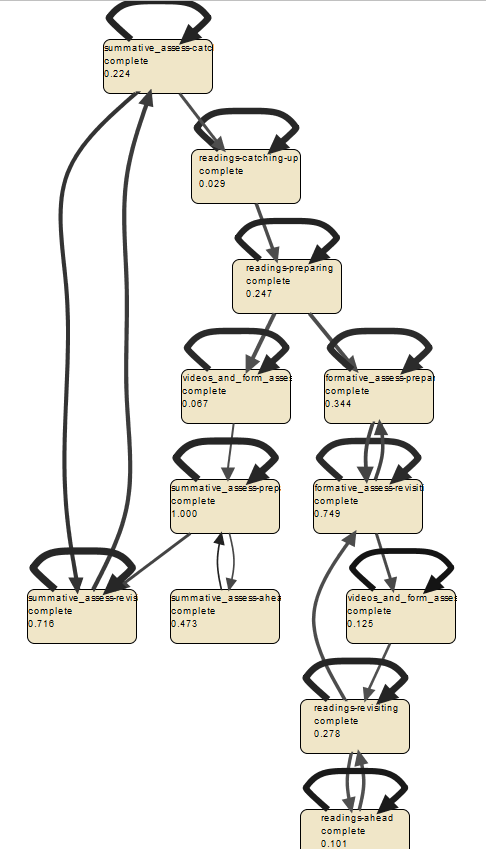
I am running the fuzzy miner plug in on Prom and I get a nice chart:

However, I would like to see the binary metrics as well as the unary ones. They seem to be checked when I run the plug-in but nothing shows up.
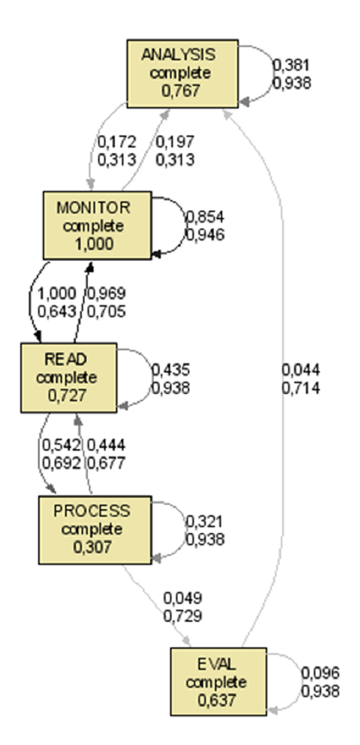
Below is an example of what I’m looking for (it has the binary metrics for significance and correlation):

Many thanks,
John
Comments
-
Hi John,
I guess these two charts come from two different logs. So which tool are you using to get the second chart? I do not know the definition of significance and correlation? I will forward the problem to my colleagure who is more familiar with fuzzy miner.
-
Hi John,
The significance and correlation metrics are taken into account when mining the fuzzy model (no problem there), but they are not shown as edge labels in ProM 6. Only if you hover on an edge, will they be shown, and only for the edge hovered on. Sorry to say, but as far as I know, there are no visualizers for fuzzy graphs that show these edge metrics the way you want them.
Kind regards,
Eric.
-
Hi there,
Thanks for your prompt replies!
The second chart is a screen shot from a journal article on PM. I believe it was generated from an earlier version of Prom.
I am surprised that teh current version does not support this...
Oh well....
Howdy, Stranger!
Categories
- 1.6K All Categories
- 45 Announcements / News
- 225 Process Mining
- 6 - BPI Challenge 2020
- 9 - BPI Challenge 2019
- 24 - BPI Challenge 2018
- 27 - BPI Challenge 2017
- 8 - BPI Challenge 2016
- 68 Research
- 1K ProM 6
- 395 - Usage
- 291 - Development
- 9 RapidProM
- 1 - Usage
- 7 - Development
- 54 ProM5
- 19 - Usage
- 188 Event Logs
- 32 - ProMimport
- 75 - XESame

